Solve the problem. Use the critical-value approach.
-A sheet-metal press stamps out bolt washers with a nominal inner diameter of 0.25 inches. Measurement of the inner diameters of a random sample of 14 washers produced the following Results (in inches) :
The normal scores of the data are summarized below: 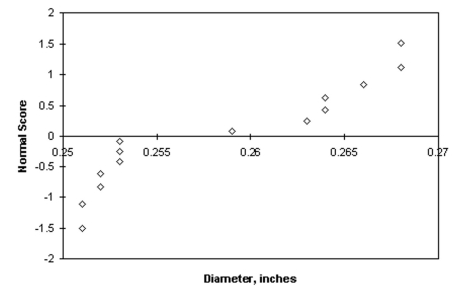
Using technology, perform the following hypothesis test: at the significance level, determine whether the mean washer diameter for this machine exceeds the nominal value. Comment on the appropriateness of the test.
A) Test statistic: ; Critical value: .
Since the test statistic is less than the critical value, do not reject the null hypothesis inches. There is insufficient evidence to conclude that the inner diameter is larger than the nominal value. However, the normal probability plot indicates that the data are not distributed normally, so the t-test may not be appropriate.
B) Test statistic: ; Critical value: .
Since the test statistic is less than the critical value, do not reject the null hypothesis
inches. There is insufficient evidence to conclude that the inner diameter is larger than the nominal value. The normal probability distribution plot indicates that the t-test is an appropriate test.
C) Test statistic: ; Critical value: .
Since the test statistic is greater than the critical value, reject the null hypothesis inches.
There is sufficient evidence to conclude that the inner diameter is larger than the nominal value. However, the normal probability plot indicates that the data are not distributed normally, so the t-test may not be appropriate.
D) Test statistic: ; Critical value: .
Since the test statistic is greater than the critical value, reject the null hypothesis inches.
There is sufficient evidence to conclude that the inner diameter is larger than the nominal value. However, the normal probability plot indicates that the data are not distributed normally, so the t-test may not be appropriate.
Correct Answer:
Verified
Q12: Provide an appropriate response.
-For a fixed sample
Q13: Construct a graph portraying the decision
Q14: Two graphical displays are given for
Q15: Solve the problem. Use the critical-value approach.
-A
Q16: Construct a graph portraying the decision
Q18: Solve the problem. Use the critical-value
Q19: Provide an appropriate response.
-Suppose that you want
Q20: A hypothesis test for a population
Q21: Two graphical displays are given for a
Q22: In 1995, the mean math SAT
Unlock this Answer For Free Now!
View this answer and more for free by performing one of the following actions

Scan the QR code to install the App and get 2 free unlocks

Unlock quizzes for free by uploading documents