Two graphical displays are given for a set of data. A hypothesis test is to be performed for the mean of the populationfrom which the data were obtained. Would it be reasonable to use a one-mean z-test? Explain your reasoning. Assumethat the population standard deviation is known.
-A normal probability plot and a stem-and-leaf diagram of the data are given below. 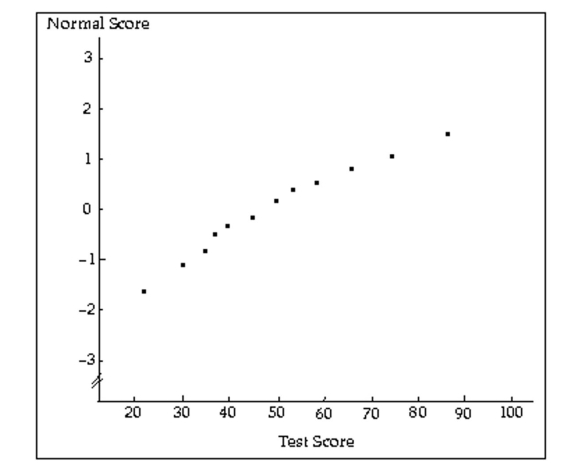
Correct Answer:
Verified
View Answer
Unlock this answer now
Get Access to more Verified Answers free of charge
Q9: Perform a one-sample z-test for a
Q10: A high school biology student wishes
Q11: Provide an appropriate response.
-Give an example
Q12: Provide an appropriate response.
-For a fixed sample
Q13: Construct a graph portraying the decision
Q15: Solve the problem. Use the critical-value approach.
-A
Q16: Construct a graph portraying the decision
Q17: Solve the problem. Use the critical-value
Q18: Solve the problem. Use the critical-value
Q19: Provide an appropriate response.
-Suppose that you want
Unlock this Answer For Free Now!
View this answer and more for free by performing one of the following actions

Scan the QR code to install the App and get 2 free unlocks

Unlock quizzes for free by uploading documents