Multiple Choice
The following pie chart presents the percentages of fish caught in each of four ratings cate
Match this pie chart with its corresponding bar graph.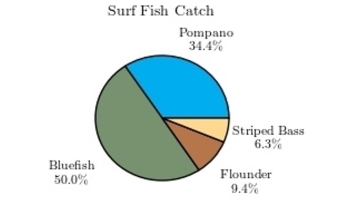
gories.
A) 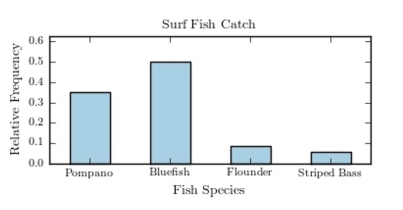
B) 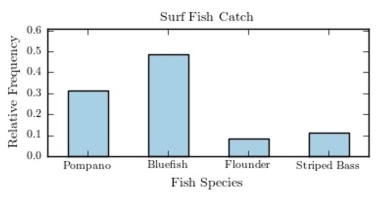
C) 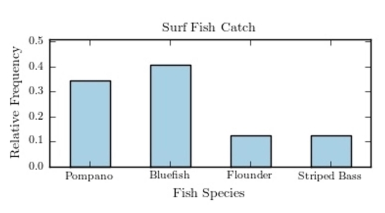
D) 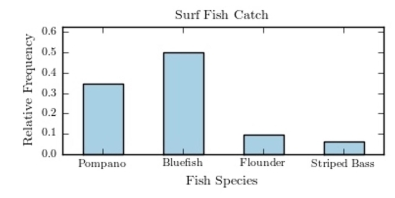
Correct Answer:
Verified
Related Questions
Q75: Q76: The following frequency distribution presents the Q77: The following information shows the colors Q78: A sample of 200 high school Q79: A sample of 200 high school Unlock this Answer For Free Now! View this answer and more for free by performing one of the following actions Scan the QR code to install the App and get 2 free unlocks Unlock quizzes for free by uploading documents

