The following frequency distribution presents the frequency of passenger vehicles that pa: through a certain intersection from 8:00 AM to 9:00 AM on a particular day.
Construct a relative frequency Parato chart for the data. s
A) 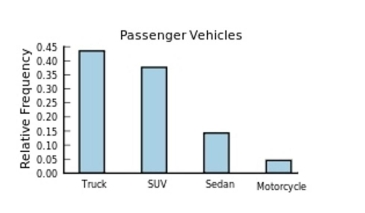
B) 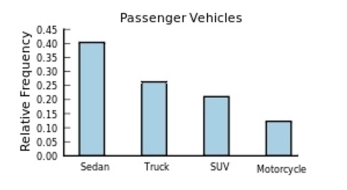
C) 
D) 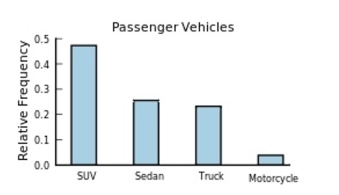
Correct Answer:
Verified
Q71: The following bar graph presents the average
Q72: The following frequency distribution presents the
Q73: Following is a pie chart that
Q74: The following frequency distribution presents the
Q75: Q77: The following information shows the colors Q78: A sample of 200 high school Q79: A sample of 200 high school Q80: The following pie chart presents the percentages Q81:
Unlock this Answer For Free Now!
View this answer and more for free by performing one of the following actions

Scan the QR code to install the App and get 2 free unlocks

Unlock quizzes for free by uploading documents