Multiple Choice
A sample of 200 high school students were asked how many hours per week they spend u television. The following frequency distribution presents the results.
Construct a relative frequency polygon for the frequency distribution.
A) 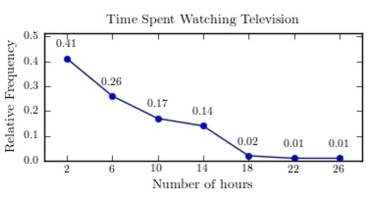
B) 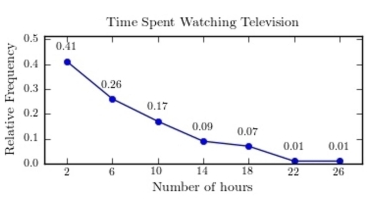
C) 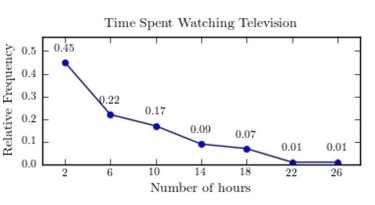
D) 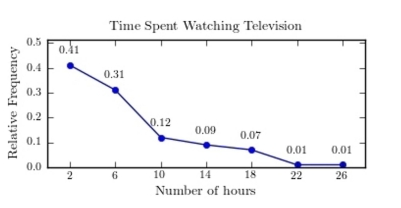
Correct Answer:
Verified
Related Questions
Q74: The following frequency distribution presents the
Q75: Q76: The following frequency distribution presents the Q77: The following information shows the colors Q78: A sample of 200 high school Q80: The following pie chart presents the percentages Unlock this Answer For Free Now! View this answer and more for free by performing one of the following actions Scan the QR code to install the App and get 2 free unlocks Unlock quizzes for free by uploading documents

