Multiple Choice
The following frequency distribution presents the frequency of passenger vehicles that pa through a certain intersection from 8:00 AM to 9:00 AM on a particular day.
Construct a frequency bar graph for the data.
A) 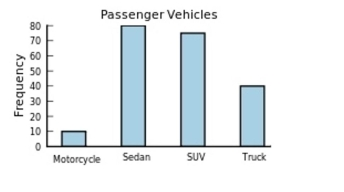
B) 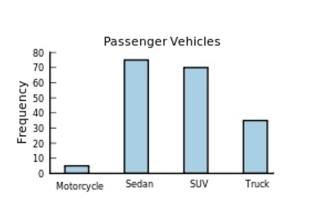
C) 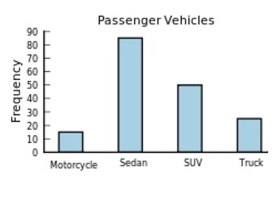
D) 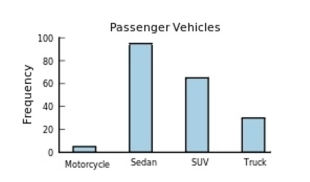
Correct Answer:
Verified
Related Questions
Q69: 
Q70: Q71: The following bar graph presents the average Q72: The following frequency distribution presents the Q73: Following is a pie chart that
Unlock this Answer For Free Now!
View this answer and more for free by performing one of the following actions

Scan the QR code to install the App and get 2 free unlocks

Unlock quizzes for free by uploading documents