The figure shows a diagram for an ideal gas that is carried around a cyclic process. How much work is done in one cycle if and ? 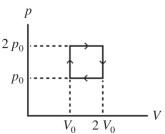
A)
B)
C)
D)
E)
Correct Answer:
Verified
Q21: The figure shows a
Q22: A gas expands from an initial
Q23: An ideal gas undergoes the process
Q24: A certain automobile engine takes in 4.00
Q25: An ideal gas undergoes the process
Q27: During each cycle, a heat engine takes
Q28: A 40.0-L container is divided into
Q29: A heat engine absorbs 64 kcal of
Q30: The figure shows a
Q31: An ideal gas undergoes the process
Unlock this Answer For Free Now!
View this answer and more for free by performing one of the following actions

Scan the QR code to install the App and get 2 free unlocks

Unlock quizzes for free by uploading documents