The figure shows a diagram for a gas going through a cycle from to to and back to A. From point to point , the gas absorbs of heat and finds its internal (thermal) energy has increased by . Going from B to , the internal (thermal) energy decreases by .
(a) How much work was done by the gas from to ?
(b) How much heat was absorbed by the gas from to ?
(c) How much work was done by the gas going from to ?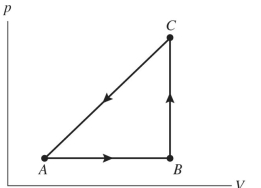
Correct Answer:
Verified
(b)
View Answer
Unlock this answer now
Get Access to more Verified Answers free of charge
Q16: The figure shows a
Q17: The figure shows a
Q18: If the efficiency of a Carnot
Q19: Two processes are shown on the
Q20: A 10-L flask and a 1-L
Q22: A gas expands from an initial
Q23: An ideal gas undergoes the process
Q24: A certain automobile engine takes in 4.00
Q25: An ideal gas undergoes the process
Q26: The figure shows a
Unlock this Answer For Free Now!
View this answer and more for free by performing one of the following actions

Scan the QR code to install the App and get 2 free unlocks

Unlock quizzes for free by uploading documents