Describe What Can Make a Graph Misleading or Deceptive
-A parcel delivery store finds that their delivery rates increased over the past year. Last year it delivered 3402 parcels. This year it delivered 8942 parcels. 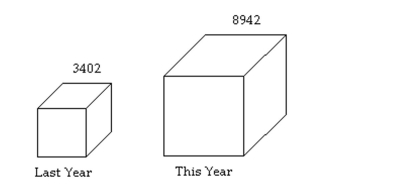 How many times larger should the graphic for this year be than the graphic for last year
Correct Answer:
Verified
View Answer
Unlock this answer now
Get Access to more Verified Answers free of charge
Q67: Create Cumulative Frequency and Relative Frequency
Q68: Describe What Can Make a Graph
Q69: Create Cumulative Frequency and Relative Frequency
Q70: Create Cumulative Frequency and Relative Frequency
Q71: Draw Time-Series Graphs
-The data below represent
Q72: Draw Time-Series Graphs
-Women were allowed to
Q73: Describe What Can Make a Graph Misleading
Q74: Draw Time-Series Graphs
-A transportation engineer wishes
Q75: Create Cumulative Frequency and Relative Frequency
Q76: Create Cumulative Frequency and Relative Frequency
Unlock this Answer For Free Now!
View this answer and more for free by performing one of the following actions

Scan the QR code to install the App and get 2 free unlocks

Unlock quizzes for free by uploading documents