A control chart for is shown below. Determine whether the process mean is within statistical control. If it is
not, identify which of the three out-of-control criteria lead to rejection of a statistically stable mean. 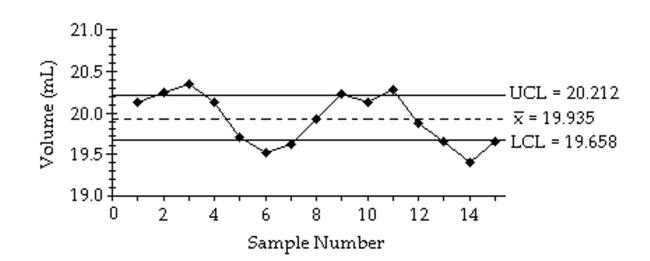
Correct Answer:
Verified
View Answer
Unlock this answer now
Get Access to more Verified Answers free of charge
Q74: A machine that is supposed to produce
Q75: A run chart for individual values is
Q76: A machine that is supposed to produce
Q77: A machine is supposed to fill cans
Q78: A control chart for R is shown
Q80: A manufacturer monitors the level of
Q81: Match the chart with its characteristic.
Q82: A drugstore considers a wait of
Q83: 
Q84: If the weight of cereal in
Unlock this Answer For Free Now!
View this answer and more for free by performing one of the following actions

Scan the QR code to install the App and get 2 free unlocks

Unlock quizzes for free by uploading documents