A control chart for R is shown below. Determine whether the process variation is within statistical control. If it
is not, identify which of the three out-of-control criteria lead to rejection of statistically stable variation. 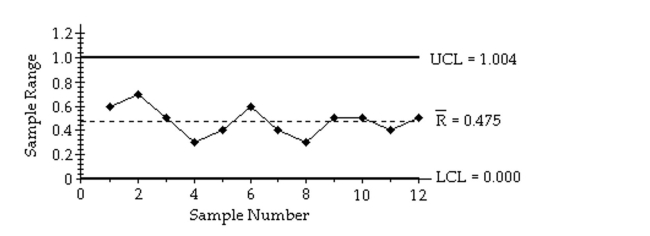
Correct Answer:
Verified
View Answer
Unlock this answer now
Get Access to more Verified Answers free of charge
Q73: A machine is supposed to fill cans
Q74: A machine that is supposed to produce
Q75: A run chart for individual values is
Q76: A machine that is supposed to produce
Q77: A machine is supposed to fill cans
Q79: A control chart for
Q80: A manufacturer monitors the level of
Q81: Match the chart with its characteristic.
Q82: A drugstore considers a wait of
Q83: 
Unlock this Answer For Free Now!
View this answer and more for free by performing one of the following actions

Scan the QR code to install the App and get 2 free unlocks

Unlock quizzes for free by uploading documents