A run chart for individual values is shown below. Does there appear to be a pattern suggesting that the process
is not within statistical control? If so, describe the pattern. 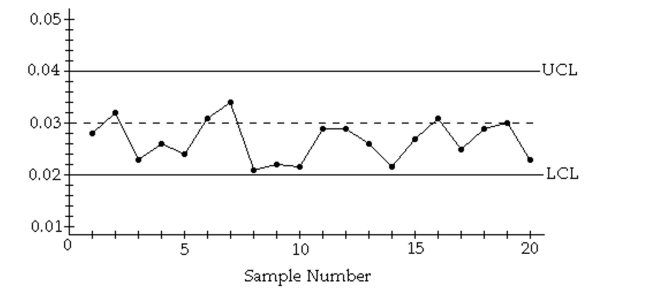
Correct Answer:
Verified
View Answer
Unlock this answer now
Get Access to more Verified Answers free of charge
Q70: A machine is supposed to fill boxes
Q71: A control chart for R is shown
Q72: A machine that is supposed to fill
Q73: A machine is supposed to fill cans
Q74: A machine that is supposed to produce
Q76: A machine that is supposed to produce
Q77: A machine is supposed to fill cans
Q78: A control chart for R is shown
Q79: A control chart for
Q80: A manufacturer monitors the level of
Unlock this Answer For Free Now!
View this answer and more for free by performing one of the following actions

Scan the QR code to install the App and get 2 free unlocks

Unlock quizzes for free by uploading documents