A councilman was interested in determining whether people between the ages of 18 and 30 years of age will react to a piece of legislation differently than people over 30 years of age. The legislator polled a sample of 150 people from his district. The resulting data is shown in the table below: 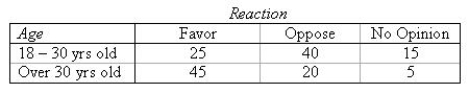 Construct a side-by-side bar chart.
Construct a pie chart for the 18 - 30 age group.
Construct a pie chart for the Over 30 age group.
Which of the two types of presentations in parts (a) and (b) is more easily understood?
______________
Correct Answer:
Verified
Q19: A scatterplot is not particularly useful in
Q20: If a regression line has a y-intercept
Q21: The number of household members, x and
Q22: A soft drink distributor was interested in
Q23: A manager of a supermarket wishes to
Q25: Which value of the correlation coefficient r
Q26: When the price of gasoline gets high,
Q27: In constructing a scatterplot, it would not
Q28: A scatterplot can be used to determine
Q29: The manager of a movie rental store
Unlock this Answer For Free Now!
View this answer and more for free by performing one of the following actions

Scan the QR code to install the App and get 2 free unlocks

Unlock quizzes for free by uploading documents