The number of household members, x and the amount spent on groceries per week, y (rounded to the nearest dollar) are measured for eight households in the Big Rapids area. The data are shown below: 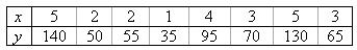 Create a raw scatterplot of these eight data points (no regression line or equation).
Find the best-fitting regression line for these data.
y = ______________
Plot the points and the best-fitting line on the same graph.
What would you estimate a household of seven to spend on groceries per week?
______________
Should you use the fitted line to estimate this amount?
______________
Why or why not?
________________________________________________________
Correct Answer:
Verified
0.1681 + 25.546x;
178.99...
View Answer
Unlock this answer now
Get Access to more Verified Answers free of charge
Q16: Which of the following are measures of
Q17: If two variables have a correlation coefficient
Q18: If the linear relationship between the dependent
Q19: A scatterplot is not particularly useful in
Q20: If a regression line has a y-intercept
Q22: A soft drink distributor was interested in
Q23: A manager of a supermarket wishes to
Q24: A councilman was interested in determining whether
Q25: Which value of the correlation coefficient r
Q26: When the price of gasoline gets high,
Unlock this Answer For Free Now!
View this answer and more for free by performing one of the following actions

Scan the QR code to install the App and get 2 free unlocks

Unlock quizzes for free by uploading documents