A soft drink distributor was interested in examining the relationship between the number of ads (x) for his product during prime time on a local television station and the number of sales per week (y) in thousands of cases. He compiled the figures for 20 weeks and computed the following summary information: 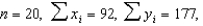
 and
and  Find the correlation coefficient for the number of ads during prime time and weekly sales.
______________
Find the best-fitting line relating the number of ads during prime time and weekly sales.
y = ______________
If the soft drink distributor ran 21 TV ads per week for his product, what would you predict his sales to be?
______________ thousand cases
Correct Answer:
Verified
View Answer
Unlock this answer now
Get Access to more Verified Answers free of charge
Q17: If two variables have a correlation coefficient
Q18: If the linear relationship between the dependent
Q19: A scatterplot is not particularly useful in
Q20: If a regression line has a y-intercept
Q21: The number of household members, x and
Q23: A manager of a supermarket wishes to
Q24: A councilman was interested in determining whether
Q25: Which value of the correlation coefficient r
Q26: When the price of gasoline gets high,
Q27: In constructing a scatterplot, it would not
Unlock this Answer For Free Now!
View this answer and more for free by performing one of the following actions

Scan the QR code to install the App and get 2 free unlocks

Unlock quizzes for free by uploading documents