The graph shown depicts a tax being imposed, causing demand to shift from D1 to D2. 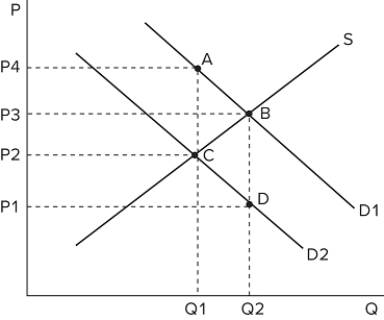 The distance in the graph from point A to point C represents all of the following except:
A) the amount of the tax.
B) the difference between the price paid by consumers and the price received by sellers.
C) the "tax wedge".
D) the total tax revenue generated for the government.
Correct Answer:
Verified
Q12: A tax will sometimes alter consumers' incentives.
Q13: The graph shown depicts a tax being
Q14: Taxes change behavior in which of the
Q15: Which of the following is an example
Q16: A tax on which of the following
Q18: In deciding which programs the government should
Q19: One cost associated with the imposition of
Q20: The graph shown depicts a tax being
Q21: The effort used to collect and manage
Q22: Considering a given increase in price due
Unlock this Answer For Free Now!
View this answer and more for free by performing one of the following actions

Scan the QR code to install the App and get 2 free unlocks

Unlock quizzes for free by uploading documents