The graph shown demonstrates the domestic demand and supply for a good, as well as a tariff and the world price for that good. 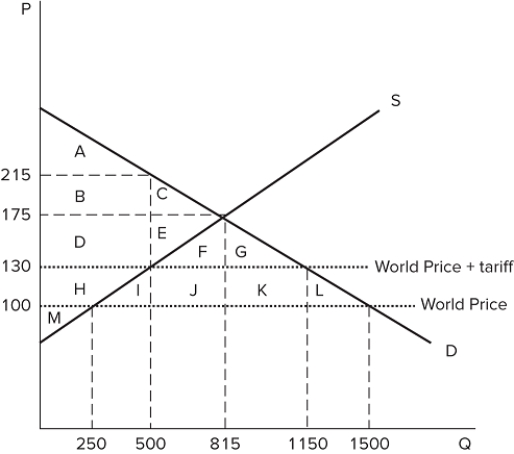 Which area(s) represent the amount of surplus enjoyed by domestic consumers with free trade before the tariff is imposed?
A) A
B) A + B + C
C) A + B + C + D + E + F + G
D) A + B + C + D + E + F + G + H + I + J + K + L
Correct Answer:
Verified
Q108: The graph shown demonstrates the domestic demand
Q109: The graph shown demonstrates the domestic demand
Q110: The graph shown demonstrates the domestic demand
Q111: The graph shown demonstrates the domestic demand
Q112: The graph shown demonstrates the domestic demand
Q114: The graph shown demonstrates the domestic demand
Q115: The graph shown demonstrates the domestic demand
Q116: The graph shown demonstrates the domestic demand
Q117: The graph shown demonstrates the domestic demand
Q118: The graph shown demonstrates the domestic demand
Unlock this Answer For Free Now!
View this answer and more for free by performing one of the following actions

Scan the QR code to install the App and get 2 free unlocks

Unlock quizzes for free by uploading documents