
Use the figure to answer the following question.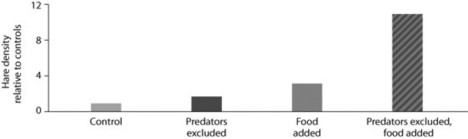
Looking at the data in the figure from the hare/lynx experiment, what conclusion(s) can you draw?
I.Food is a factor in controlling hare population size.
II.Excluding lynx is a factor in controlling hare population size.
III.The effect of excluding predators and adding food in the same experiment is greater than the sum of excluding lynx alone plus adding food alone.
A) only I
B) only II
C) only III
D) I, II, and III
Correct Answer:
Verified
Q44: A population of white-footed mice becomes severely
Q49: Use the graphs to answer the following
Q51: Use the figure to answer the following
Q51: Which pair of terms most accurately describes
Q52: Which of the following graphs illustrates the
Q54: Use the figure to answer the following
Q56: Use the graph to answer the following
Q57: Use the figure to answer the following
Q58: Which of the following statements about human
Q59: In which of the following situations would
Unlock this Answer For Free Now!
View this answer and more for free by performing one of the following actions

Scan the QR code to install the App and get 2 free unlocks

Unlock quizzes for free by uploading documents