
Which of the following graphs illustrates the growth over several seasons of a population of snowshoe hares that were introduced to an appropriate habitat also inhabited by predators in northern Canada?
A) 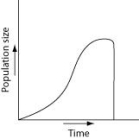
B) 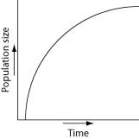
C) 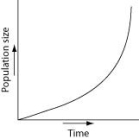
D) 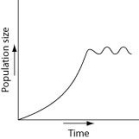
Correct Answer:
Verified
Q47: The following question refers to the figure
Q49: Use the graphs to answer the following
Q51: Use the figure to answer the following
Q51: Which pair of terms most accurately describes
Q53: Use the figure to answer the following
Q54: Use the figure to answer the following
Q56: Use the graph to answer the following
Q57: Use the figure to answer the following
Q58: Which of the following statements about human
Q59: In which of the following situations would
Unlock this Answer For Free Now!
View this answer and more for free by performing one of the following actions

Scan the QR code to install the App and get 2 free unlocks

Unlock quizzes for free by uploading documents