Multiple Choice
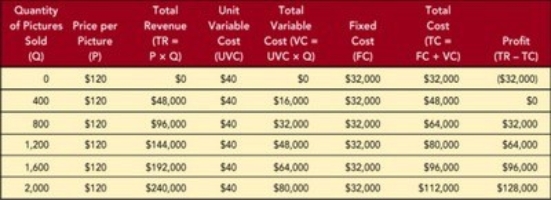 Figure 11-6
-A graphic presentation of the break-even analysis that shows the intersection of total revenue and total cost to identify profit or loss for a given quantity sold is referred to as a
A) Gantt chart.
B) demand curve.
C) ROI analysis.
D) cross-tabulation.
E) break-even chart.
Correct Answer:
Verified
Related Questions

