Multiple Choice
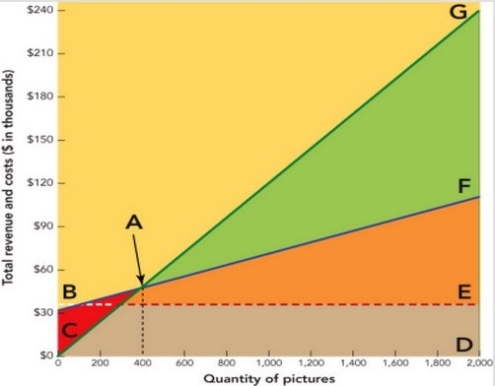 Figure 11-6a
-In Figure 11-7a above, which is a break-even chart that depicts a graphic presentation of a break-even analysis for a picture frame store, the area CGD represents the firm's
A) fixed costs.
B) break-even point.
C) variable costs.
D) profit.
E) total revenue.
Correct Answer:
Verified
Related Questions

