Multiple Choice
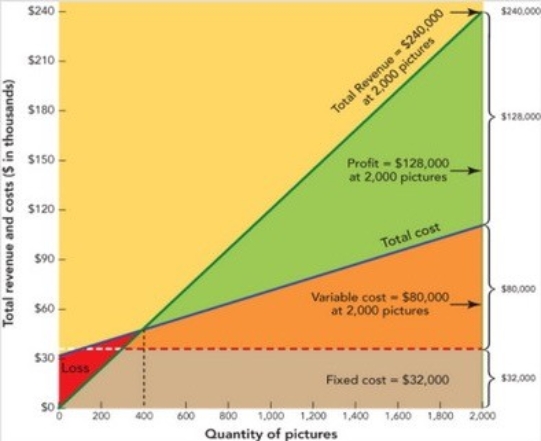 Figure 11-7
-Figure 11-7 above depicts a
A) Gantt chart.
B) demand curve.
C) break-even chart.
D) ROI analysis.
E) cross-tabulation.
Correct Answer:
Verified
Related Questions
Q164: Rent, executive salaries, and insurance are typical
Q170: Unit variable cost refers to variable cost
Q173: Variable cost is
A) the sum of the
Q187: Break-even analysis is
A) a process that investigates
Q194: Ampro-Mag makes materials for safely controlling hazardous
Q199: The owner of a small restaurant that

