The diagram illustrates possible changes in red blood cell volume resulting from a change in extracellular fluid composition for a cell equilibrated in a 150 mmol/L solution of sodium chloride (NaCl) at time zero. Which curve best illustrates the volume change caused by immersion of the cell in an aqueous solution of 300 mOsm/L calcium chloride (CaCl2)? 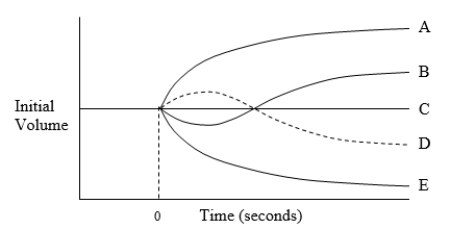
Correct Answer:
Verified
Q5: A cell is equilibrated in an aqueous
Q6: The diagram shows a bag (with
Q7: The diagram shows a model cell that
Q8: The diagram illustrates possible changes in red
Q9: The diagram illustrates possible changes in red
Q11: Which of the following substances is most
Q12: Secondary active transport typically moves which
Q13: Which of the following substances are most
Q14: Cardiac glycosides can increase the intracellular calcium
Q15: Two compartments (
Unlock this Answer For Free Now!
View this answer and more for free by performing one of the following actions

Scan the QR code to install the App and get 2 free unlocks

Unlock quizzes for free by uploading documents