The diagram illustrates possible changes in red blood cell volume resulting from a change in extracellular fluid composition for a cell equilibrated in a 150 mmol/L solution of sodium chloride (NaCl) at time zero. Which curve best illustrates the volume change caused by immersion of the cell in an aqueous solution of 200 mOsm/L NaCl and 200 mOsm/L glycerol? 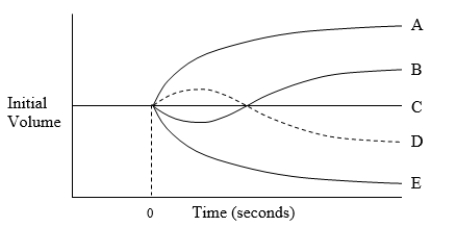
Correct Answer:
Verified
Q4: A cell placed in a hypertonic solution
Q5: A cell is equilibrated in an aqueous
Q6: The diagram shows a bag (with
Q7: The diagram shows a model cell that
Q8: The diagram illustrates possible changes in red
Q10: The diagram illustrates possible changes in red
Q11: Which of the following substances is most
Q12: Secondary active transport typically moves which
Q13: Which of the following substances are most
Q14: Cardiac glycosides can increase the intracellular calcium
Unlock this Answer For Free Now!
View this answer and more for free by performing one of the following actions

Scan the QR code to install the App and get 2 free unlocks

Unlock quizzes for free by uploading documents