RNA-seq and ribosome profiling experiments have been carried out on the same cells. The following simplified graphs show the results for the same genomic region containing a gene with three exons. Which graph (1 or 2) do you think corresponds to the RNA-seq results? What feature is represented by the arrow? 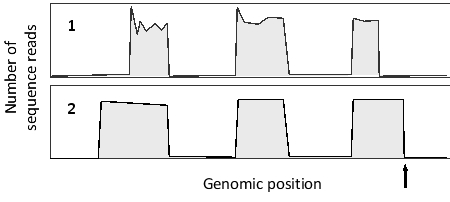
A) Graph 1; stop codon
B) Graph 1; polyadenylation site
C) Graph 2; stop codon
D) Graph 2; polyadenylation site
Correct Answer:
Verified
Q60: The p53 gene is an important tumor
Q61: You have created transgenic mice that carry
Q62: Consider a transcription regulatory protein (A) that
Q63: Consider the binding of a transcription regulatory
Q64: Consider a protein composed of only 21
Q66: When a promoter p is not saturated
Q67: You have used a reporter gene system
Q68: Consider a transcription regulatory protein (A) that
Q69: Everything else being equal, if the mean
Q70: Sort the following steps in the common
Unlock this Answer For Free Now!
View this answer and more for free by performing one of the following actions

Scan the QR code to install the App and get 2 free unlocks

Unlock quizzes for free by uploading documents