In the following graph that shows changes in the lengths of two microtubules over time, which time point corresponds to a catastrophe for both microtubules? Which trace corresponds to a microtubule with greater dynamic instability? 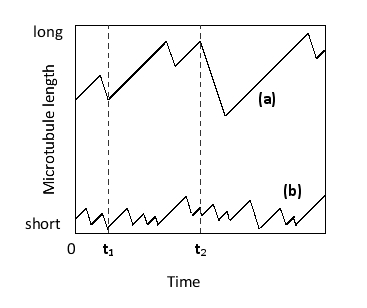
A) t₁; trace (a)
B) t₁; trace (b)
C) t₂; trace (a)
D) t₂; trace (b)
Correct Answer:
Verified
Q54: Which of the following proteins do you
Q55: Indicate whether each of the following descriptions
Q56: A dimeric kinesin-1 molecule has 8-nm steps
Q57: Indicate true (T) and false (F) statements
Q58: A small unique insert found near the
Q60: Indicate true (T) and false (F) statements
Q61: How is membrane protrusion by blebbing different
Q62: Which of the following is NOT an
Q63: In lamellipodia, actin polymerization is nucleated by
Q64: Considering the diagram below, which summarizes two
Unlock this Answer For Free Now!
View this answer and more for free by performing one of the following actions

Scan the QR code to install the App and get 2 free unlocks

Unlock quizzes for free by uploading documents