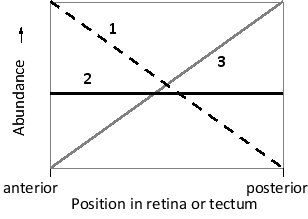
In the following graph, which line (1 to 3) better represents the changes in the level of EphA receptors on retinal axons along the anterior-posterior axis of the mouse retina? Which line better represents the changes in the abundance of EphrinA along the anterior-posterior axis of the mouse optical tectum? Write down your answer as a two-digit number, e.g. 22.
Correct Answer:
Verified
View Answer
Unlock this answer now
Get Access to more Verified Answers free of charge
Q42: After reaching sexual maturity, the nematode Caenorhabditis
Q43: You grow neurons in culture in the
Q44: Robo3.1 is an alternative splice form of
Q45: Consider the embryonic cerebral cortex of a
Q46: If explants that can produce axons from
Q48: You have grown neurons in a culture
Q49: An axonal growth cone has reached a
Q50: Indicate whether each of the following conditions
Q51: You have obtained leaf samples from three
Q52: Consider Agrin signaling in the formation of
Unlock this Answer For Free Now!
View this answer and more for free by performing one of the following actions

Scan the QR code to install the App and get 2 free unlocks

Unlock quizzes for free by uploading documents