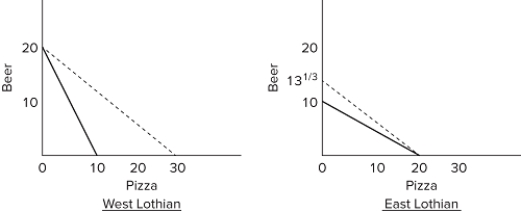
 In the accompanying diagrams, solid lines are production possibilities curves, and the dashed lines are trading possibilities curves. The data contained in the production possibilities curves are based on the assumption of
A) imperfect substitutability of resources between beer and pizza production.
B) constant costs.
C) decreasing costs.
D) increasing costs.
Correct Answer:
Verified
Q1: As a percentage of GDP, U.S. exports
Q39: The fact that international specialization and trade
Q77: The accompanying tables give production possibilities data
Q79: In order for mutually beneficial trade to
Q80: Answer the question on the basis of
Q81: If a nation has a comparative advantage
Q83: Q84: Answer the question on the basis of Q86: Answer the question using the accompanying cost Q87: ![]()
![]()
Unlock this Answer For Free Now!
View this answer and more for free by performing one of the following actions

Scan the QR code to install the App and get 2 free unlocks

Unlock quizzes for free by uploading documents