Multiple Choice
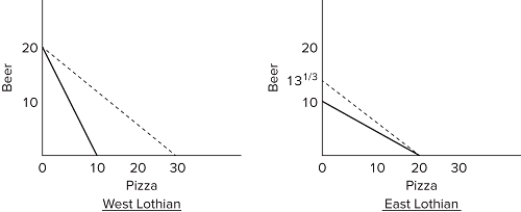 In the accompanying diagrams, solid lines are production possibilities curves, and the dashed lines are trading possibilities curves. The trading possibilities curves suggest that the terms of trade are
A) 1.5 beers for 1 pizza.
B) 1 beer for 2 pizzas.
C) 2 beers for 1 pizza.
D) 1 beer for 1.5 pizzas.
Correct Answer:
Verified
Related Questions

