Multiple Choice
Figure 10-7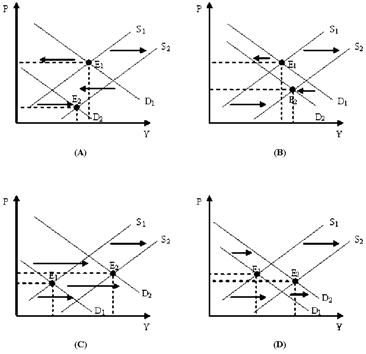
Which of the diagrams in Figure 10-7 represents a decrease in consumer spending combined with a positive supply shock?
A) (A) and (B)
B) (C) and (D)
C) (A) and (C)
D) (B) and (D)
Correct Answer:
Verified
Related Questions

