Multiple Choice
Figure 10-7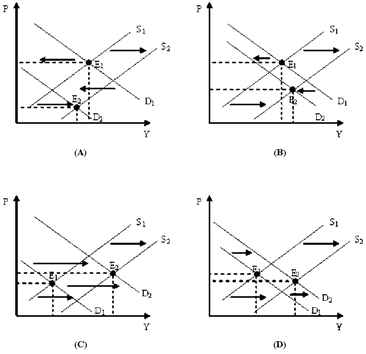
Which of the diagrams in Figure 10-7 shows an economic recession caused primarily by a change aggregate demand?
A) (A)
B) (B)
C) (C)
D) (D)
Correct Answer:
Verified
Related Questions
Q181: Economists believed that the U.S.economy had a
Q201: Figure 10-7 Q203: Figure 10-9 Q204: Figure 10-7 Q206: Figure 10-8 Q208: Figure 10-7 Q209: Figure 10-9 Q212: From the mid-1980s until late 2007, many Q213: Figure 10-9 Q216: Distinguish between a movement along the aggregate Unlock this Answer For Free Now! View this answer and more for free by performing one of the following actions Scan the QR code to install the App and get 2 free unlocks Unlock quizzes for free by uploading documents![]()
![]()
![]()
![]()
![]()
![]()
![]()

