Exhibit 3-3 Demand curves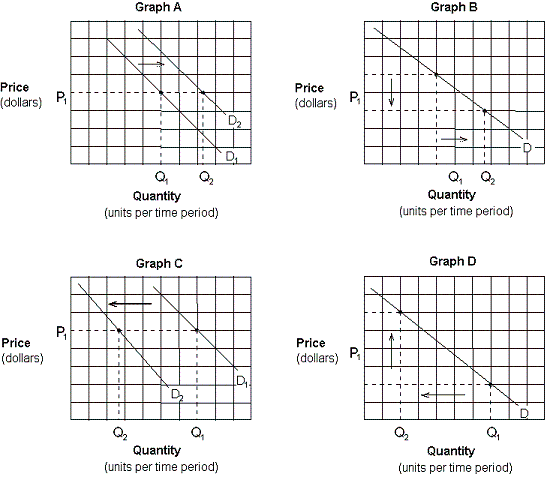
-Assume that crackers and soup are complementary goods. Which of the graphs in Exhibit 3-3 depicts the effect of a promotional discount that decreases the price of crackers on the demand for soup?
A) Graph A.
B) Graph B.
C) Graph C.
D) Graph D.
Correct Answer:
Verified
Q75: Exhibit 3-3 Demand curves Q77: The law of supply states that: Q78: Exhibit 3-3 Demand curves Q79: If a decrease in the price of Q81: A supply curve: Q83: Which of the following will cause a Q85: An increase in the quantity supplied of Q251: When economists say the supply of a Q267: When economists say the quantity supplied of Q284: According to the law of supply,![]()
A) there![]()
A) has a negative slope.
B)
A) more
Unlock this Answer For Free Now!
View this answer and more for free by performing one of the following actions

Scan the QR code to install the App and get 2 free unlocks

Unlock quizzes for free by uploading documents