Multiple Choice
Exhibit 3-3 Demand curves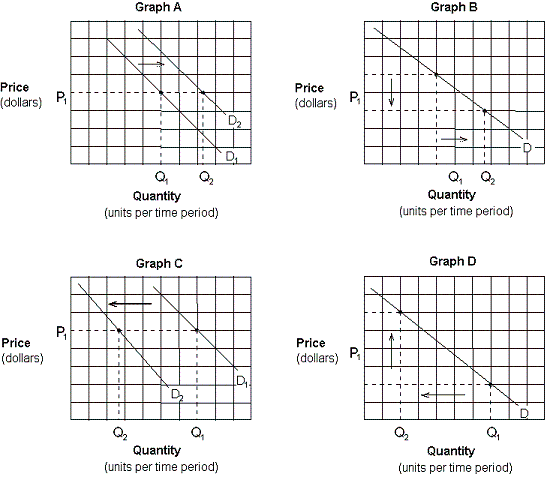
-Which of the graphs in Exhibit 3-3 depicts the effect of an increase in income on the demand for pork and beans (an inferior good) ?
A) Graph A .
B) Graph B .
C) Graph C .
D) Graph D .
Correct Answer:
Verified
Related Questions
Q73: Tasha decides that when homes in her
Q74: In general, supply curves slope upward because:
A)
Q75: Exhibit 3-3 Demand curves Q77: The law of supply states that: Q79: If a decrease in the price of![]()
A) there
Unlock this Answer For Free Now!
View this answer and more for free by performing one of the following actions

Scan the QR code to install the App and get 2 free unlocks

Unlock quizzes for free by uploading documents