Exhibit 6-15 Long-run average cost 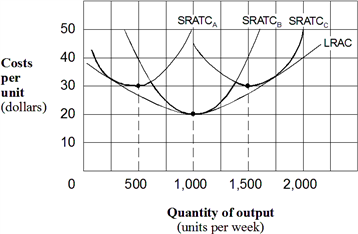 In Exhibit 6-15, diseconomies of scale are shown in the range of:
A) 0 to 500 units per week.
B) 500 to 1,000 units per week.
C) 1,000 to 2,000 units per week.
D) zero per week.
Correct Answer:
Verified
Q115: Constant returns to scale cause the long-run
Q207: Exhibit 6-14 Cost curves Q208: Constant returns to scale exist over the Q209: Exhibit 6-17 Long-run average cost curve Q211: Exhibit 6-14 Cost curves Q213: Exhibit 6-15 Long-run average cost Q214: Exhibit 6-15 Long-run average cost Q215: Exhibit 6-14 Cost curves Q216: Exhibit 6-16 Long-run average cost curves Q217: Exhibit 6-14 Cost curves Unlock this Answer For Free Now! View this answer and more for free by performing one of the following actions Scan the QR code to install the App and get 2 free unlocks Unlock quizzes for free by uploading documents![]()

![]()
![]()
![]()
![]()
![]()

