Exhibit 6-17 Long-run average cost curve 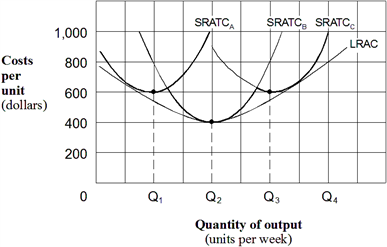 If the firm represented in Exhibit 6-17 is operating with a plant whose size corresponds to short-run average total cost curve A, the level of output that would minimize its short-run average total cost is:
A) Q1 units per week.
B) Q2 units per week.
C) Q3 units per week.
D) Q4 units per week.
Correct Answer:
Verified
Q115: Constant returns to scale cause the long-run
Q204: Exhibit 6-17 Long-run average cost curve 
Q205: Exhibit 6-15 Long-run average cost Q206: Exhibit 6-16 Long-run average cost curves Q207: Exhibit 6-14 Cost curves Q208: Constant returns to scale exist over the Q211: Exhibit 6-14 Cost curves Q212: Exhibit 6-15 Long-run average cost Q213: Exhibit 6-15 Long-run average cost Q214: Exhibit 6-15 Long-run average cost Unlock this Answer For Free Now! View this answer and more for free by performing one of the following actions Scan the QR code to install the App and get 2 free unlocks Unlock quizzes for free by uploading documents![]()
![]()
![]()
![]()
![]()
![]()

