Exhibit 13-1 This graph shows the concentration vs. time data needed for the following question(s) . 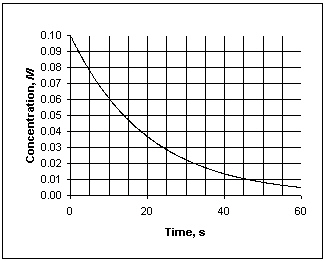
-Refer to Exhibit 13-1. What is the instantaneous rate at which concentration decreases at 30 s?
A) - 1.1×10 - 4 mol/L × s
B) - 1.1×10 - 2 mol/L × s
C) 1.1×10 - 3 mol/L × s
D) 893 mol/L × s
E) cannot answer from the data given
Correct Answer:
Verified
Q13: The rate of a chemical reaction may
Q14: Exhibit 13-3 Consider the following reaction and
Q15: Exhibit 13-1 This graph shows the concentration
Q16: Exhibit 13-3 Consider the following reaction and
Q17: Exhibit 13-3 Consider the following reaction and
Q19: The rate of reaction is influenced by:
A)
Q20: Oxygen gas is formed by the following
Q21: Which units listed below is the best
Q22: What units would be used for the
Q23: Consider the following reaction. 3 O2 (g)→2
Unlock this Answer For Free Now!
View this answer and more for free by performing one of the following actions

Scan the QR code to install the App and get 2 free unlocks

Unlock quizzes for free by uploading documents