Exhibit 13-3 Consider the following reaction and the corresponding time-concentration table to answer the following question(s) . C2H4 (g) + O3 (g) →C2H4O (g) + O2 (g) The concentration of ozone, O3, was monitored for this reaction as a function of time and is given in the table that follows. 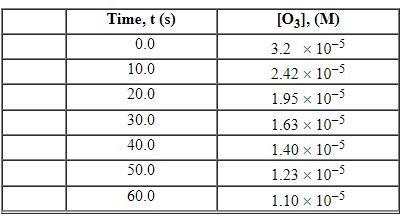
-Refer to Exhibit 13-3. What is the average rate for the time interval from 40.0 seconds tO60 seconds?
A) 1.50×10 - 7 M/s
B) 6.25×10 - 7 M/s
C) 1.10×10 - 5 M/s
D) 1.25×10 - 5 M/s
E) 1.40×10 - 5 M/s
Correct Answer:
Verified
Q9: Consider the reaction in aqueous solution:
3 I
Q10: Exhibit 13-2 Use the data set below
Q11: The diagram below is a time-concentration curve
Q12: The following are factors that influence the
Q13: The rate of a chemical reaction may
Q15: Exhibit 13-1 This graph shows the concentration
Q16: Exhibit 13-3 Consider the following reaction and
Q17: Exhibit 13-3 Consider the following reaction and
Q18: Exhibit 13-1 This graph shows the concentration
Q19: The rate of reaction is influenced by:
A)
Unlock this Answer For Free Now!
View this answer and more for free by performing one of the following actions

Scan the QR code to install the App and get 2 free unlocks

Unlock quizzes for free by uploading documents