The diagram below is a time-concentration curve for the reaction CO₂ (g) C (s) + O₂(g) . What is the average rate at which CO₂ (g) disappears over the first 25 minutes of the reaction?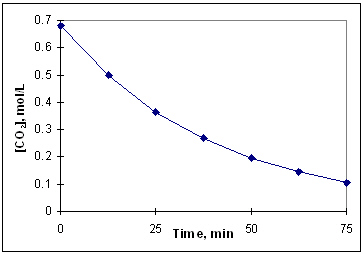
A) 0.34 mol/L × min
B) 0.17 mol/L × s
C) 0.04 mol/L × min
D) 0.68 mol/L × hr
E) 0.014 mol/L × min
Correct Answer:
Verified
Q3: Exhibit 13-3 Consider the following reaction and
Q6: Which of the following would increase the
Q8: Exhibit 13-2 Use the data set below
Q9: Consider the reaction in aqueous solution:
3 I
Q10: Exhibit 13-2 Use the data set below
Q12: The following are factors that influence the
Q13: The rate of a chemical reaction may
Q14: Exhibit 13-3 Consider the following reaction and
Q15: Exhibit 13-1 This graph shows the concentration
Q16: Exhibit 13-3 Consider the following reaction and
Unlock this Answer For Free Now!
View this answer and more for free by performing one of the following actions

Scan the QR code to install the App and get 2 free unlocks

Unlock quizzes for free by uploading documents