Exhibit 13-1 This graph shows the concentration vs. time data needed for the following question(s) . 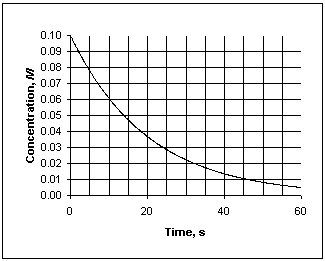
-Refer to Exhibit 13-1. What is the average rate at which concentration decreases, measured between 10 and 30 seconds?
A) 530 mol/L × s
B) 1.9×10 - 3 mol/L × s
C) - 1.9×10 - 4 mol/L × s
D) - 530 mol/L × s
E) cannot answer from the data given
Correct Answer:
Verified
Q10: Exhibit 13-2 Use the data set below
Q11: The diagram below is a time-concentration curve
Q12: The following are factors that influence the
Q13: The rate of a chemical reaction may
Q14: Exhibit 13-3 Consider the following reaction and
Q16: Exhibit 13-3 Consider the following reaction and
Q17: Exhibit 13-3 Consider the following reaction and
Q18: Exhibit 13-1 This graph shows the concentration
Q19: The rate of reaction is influenced by:
A)
Q20: Oxygen gas is formed by the following
Unlock this Answer For Free Now!
View this answer and more for free by performing one of the following actions

Scan the QR code to install the App and get 2 free unlocks

Unlock quizzes for free by uploading documents