Exhibit 13-13 Graphical analysis can be used to determine the rate law for a general reaction of reactant "A" going to products "B" and "C".
A→B + C
Refer to Exhibit 13-13. Which of the Time-Concentration plots shown below would be expected if a particular reaction follows a second order rate law ?
A) 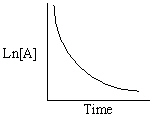
B) 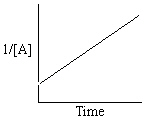
C) 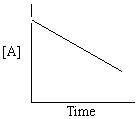
D) 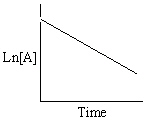
E) 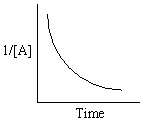
Correct Answer:
Verified
Q75: Exhibit 13-10 Consider the gas phase reaction
Q76: Exhibit 13-12 Consider the aqueous reaction and
Q77: For a reaction with the rate law
Q78: Exhibit 13-12 Consider the aqueous reaction and
Q79: Consider the Time-Concentration plots for each of
Q81: The half-life of the first order radioactive
Q82: Tritium is radioactive and decays by a
Q83: The reaction A + 2 B→Products was
Q84: The half-life of a zero order reaction
Q85: For a reaction that has the rate
Unlock this Answer For Free Now!
View this answer and more for free by performing one of the following actions

Scan the QR code to install the App and get 2 free unlocks

Unlock quizzes for free by uploading documents