A businesswoman needs to fly to Bulgaria for a conference. She watches the prices for flights and records the prices each Monday on the graph below.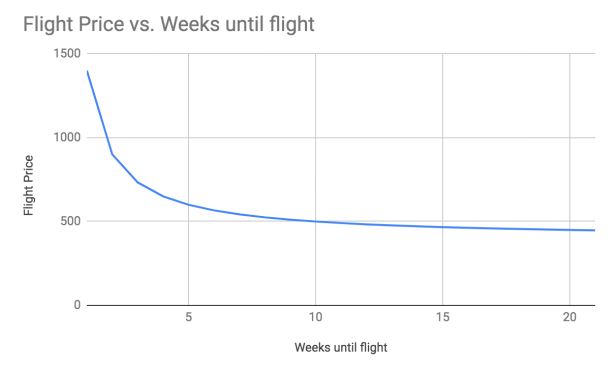 The x-axis (horizontal) shows the number of weeks leading up to the flight. Therefore, if x = 5, it means that the flight is in 5 weeks. If x = 10, the flight is in ten weeks, and so on.
Which of the following is true of the graph?
A) The graph can be used to estimate the price difference in two different destinations.
B) This graph can be used to estimate the price of flights to a different destination.
C) The graph can be used to estimate the differences in price by waiting a week.
D) More than one of these answers is correct.
Correct Answer:
Verified
Q240: A dice is suspected of being unfair.
Q241: A graph was made comparing the age
Q242: A graph was created comparing the number
Q243: A businesswoman needs to fly to Bulgaria
Q244: A businesswoman needs to fly to Bulgaria
Q246: The graph below shows the relationship between
Q247: A researcher is using this data that
Q248: A transportation company will carry specialty deliveries
Q249: A graph was created comparing the number
Q250: A businesswoman needs to fly to Bulgaria
Unlock this Answer For Free Now!
View this answer and more for free by performing one of the following actions

Scan the QR code to install the App and get 2 free unlocks

Unlock quizzes for free by uploading documents