A graph was created comparing the number of hours students spent studying and their score on the final exam.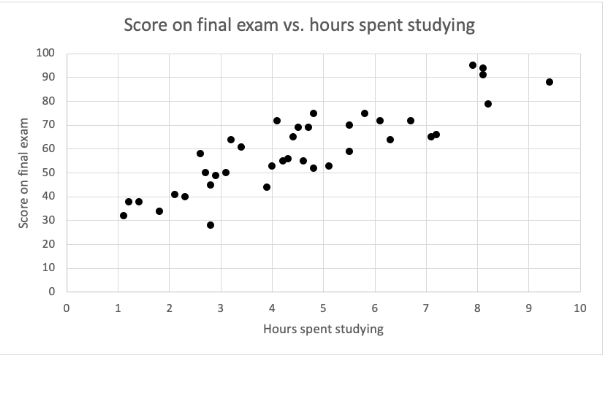 Becky wants to get a B+ in the class and in order to do this, she must get at least a 60 on the exam. What is the minimum amount of hours that she must study to have the best chance of getting above a 60, based on the graph above?
A) More than 3.5 hours
B) More than 5.5 hours
C) Less than 3 hours
D) More than 10 hours
Correct Answer:
Verified
Q244: A businesswoman needs to fly to Bulgaria
Q245: A businesswoman needs to fly to Bulgaria
Q246: The graph below shows the relationship between
Q247: A researcher is using this data that
Q248: A transportation company will carry specialty deliveries
Q250: A businesswoman needs to fly to Bulgaria
Q251: A childcare center offers up to 60
Q252: A high school asked students which mode
Q253: A graph was created comparing the number
Q254: A high school asked students which mode
Unlock this Answer For Free Now!
View this answer and more for free by performing one of the following actions

Scan the QR code to install the App and get 2 free unlocks

Unlock quizzes for free by uploading documents