A high school asked students which mode of transportation they take when the weather gets too cold to walk to school. They were also asked their distance from school. The results were put into a data table below.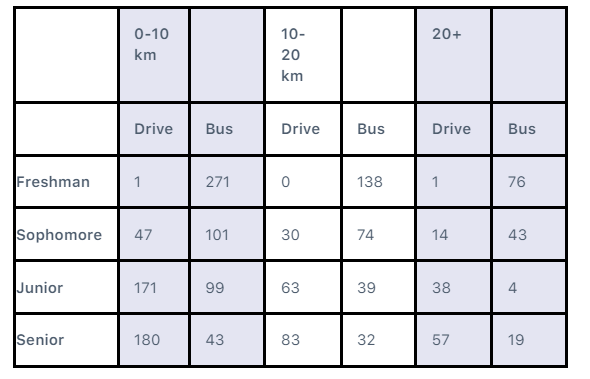
The number of freshman that live between 10 and 20 km away and drive to school is currently 0. Based on the data trends in the table, what can we predict will happen next year to the number of sophomores that live between 10 and 20 km away from school and drive.
A) We cannot predict what will happen because we do not have enough information.
B) The number will be less than zero.
C) The number will remain zero.
D) The number will be greater than zero.
Correct Answer:
Verified
Q249: A graph was created comparing the number
Q250: A businesswoman needs to fly to Bulgaria
Q251: A childcare center offers up to 60
Q252: A high school asked students which mode
Q253: A graph was created comparing the number
Q255: A researcher is using this data that
Q256: A graph was made comparing the age
Q257: A businesswoman needs to fly to Bulgaria
Q258: A high school asked students which mode
Q259: The graph below shows the relationship between
Unlock this Answer For Free Now!
View this answer and more for free by performing one of the following actions

Scan the QR code to install the App and get 2 free unlocks

Unlock quizzes for free by uploading documents