A childcare center offers up to 60 hours of care for a child during the week. The center's policy is to charge $5 per hour for the first 8 hours of each day. After that, the center charges parents $2 an hour.
Which of the following graphs most accurately shows the relationship between the cost of child care and total hours?
A) 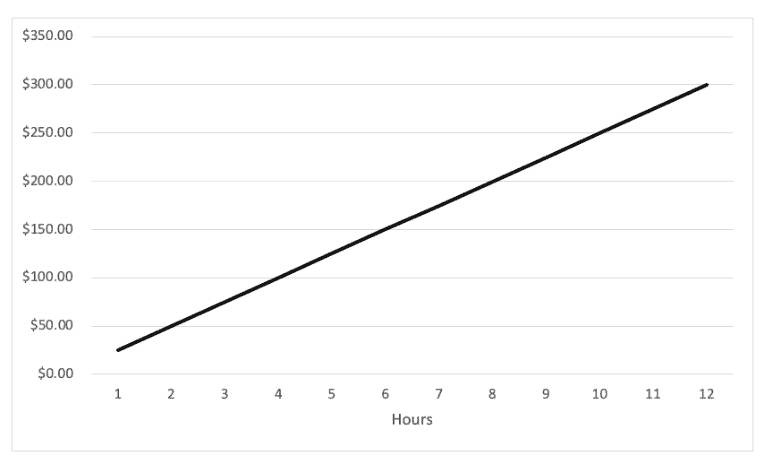
B) 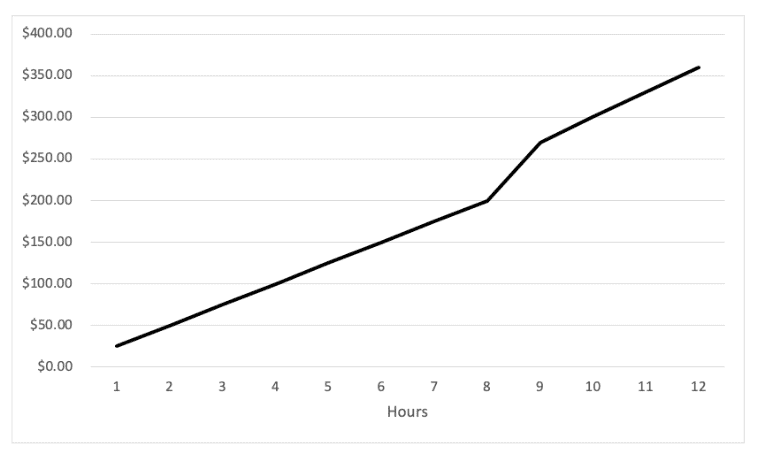
C) 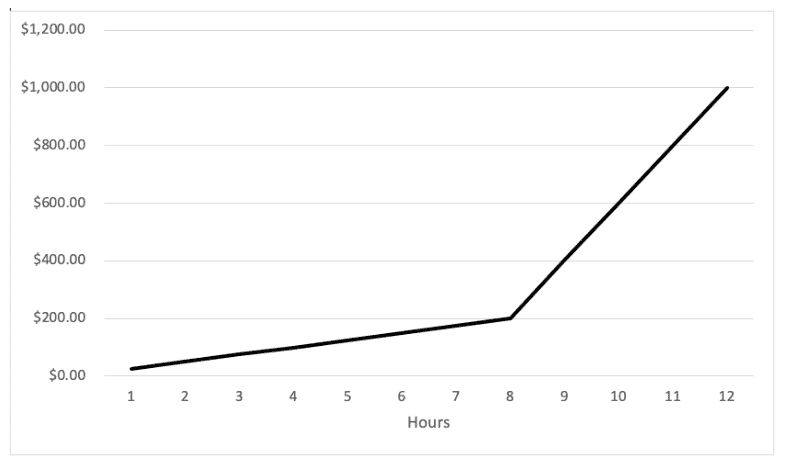
D) 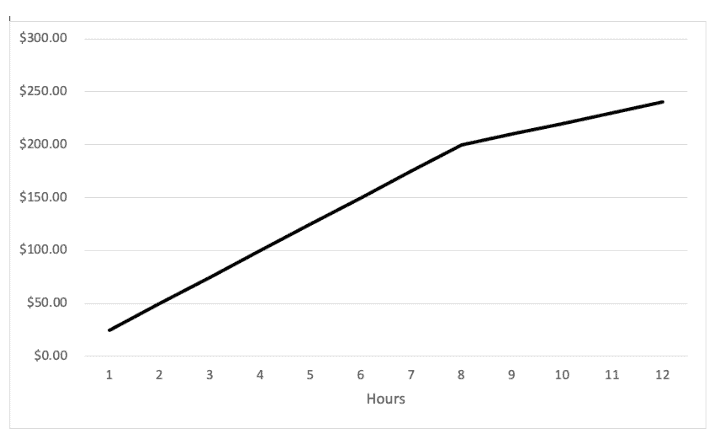
Correct Answer:
Verified
Q246: The graph below shows the relationship between
Q247: A researcher is using this data that
Q248: A transportation company will carry specialty deliveries
Q249: A graph was created comparing the number
Q250: A businesswoman needs to fly to Bulgaria
Q252: A high school asked students which mode
Q253: A graph was created comparing the number
Q254: A high school asked students which mode
Q255: A researcher is using this data that
Q256: A graph was made comparing the age
Unlock this Answer For Free Now!
View this answer and more for free by performing one of the following actions

Scan the QR code to install the App and get 2 free unlocks

Unlock quizzes for free by uploading documents