A researcher is using this data that compares ocean depth to visibility in their research paper.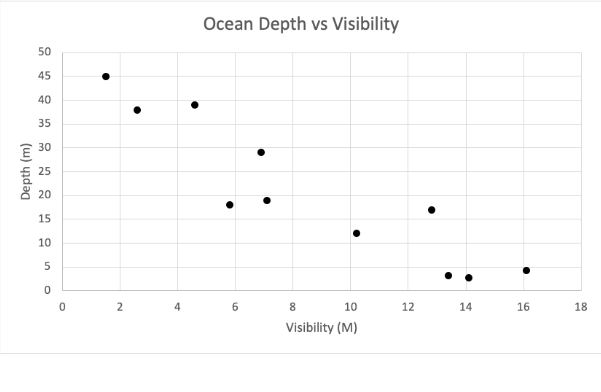 They want to reorganize the graph because the depth of the water causes the visibility to change. Which of the following changes to the axis would best represent this relationship?
A) The x axis should be flipped so that it is arranged in decreasing visibility
B) The y axis should be flipped so that it is arranged in increasing depth (going down) to mirror how the depth of the ocean increasing (getting deeper) as it goes down
C) The x and y variables should be flipped (the depth is the x variable and the visibility is the y variable)
D) None of the changes listed would correctly show this relationship.
Correct Answer:
Verified
Q242: A graph was created comparing the number
Q243: A businesswoman needs to fly to Bulgaria
Q244: A businesswoman needs to fly to Bulgaria
Q245: A businesswoman needs to fly to Bulgaria
Q246: The graph below shows the relationship between
Q248: A transportation company will carry specialty deliveries
Q249: A graph was created comparing the number
Q250: A businesswoman needs to fly to Bulgaria
Q251: A childcare center offers up to 60
Q252: A high school asked students which mode
Unlock this Answer For Free Now!
View this answer and more for free by performing one of the following actions

Scan the QR code to install the App and get 2 free unlocks

Unlock quizzes for free by uploading documents