A transportation company will carry specialty deliveries for a distance of 1200 miles. The cost for the first 600 miles is $3.75 per mile and then $0.85 per mile after that.
Which of the following graphs most accurately shows the relationship between the cost of transportation and total mileage?
A) 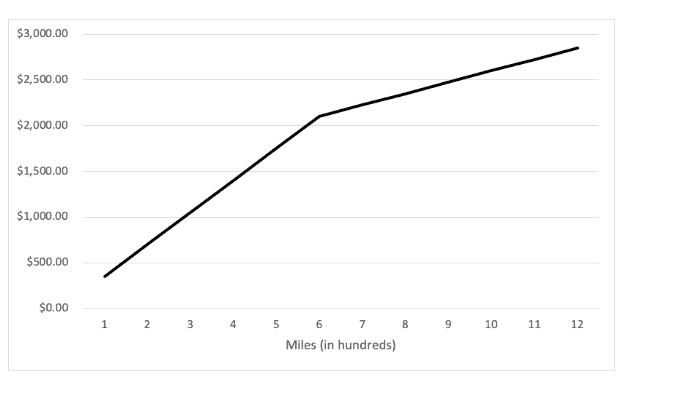
B) 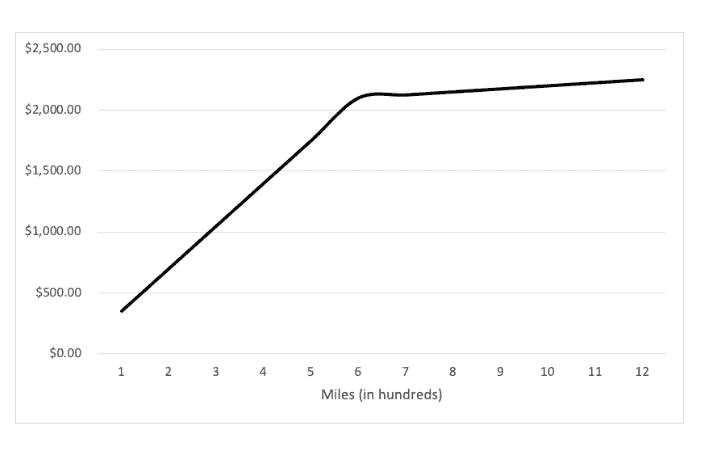
C) 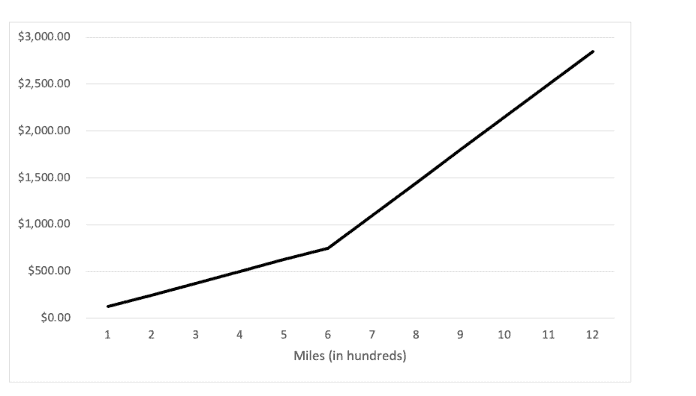
D) 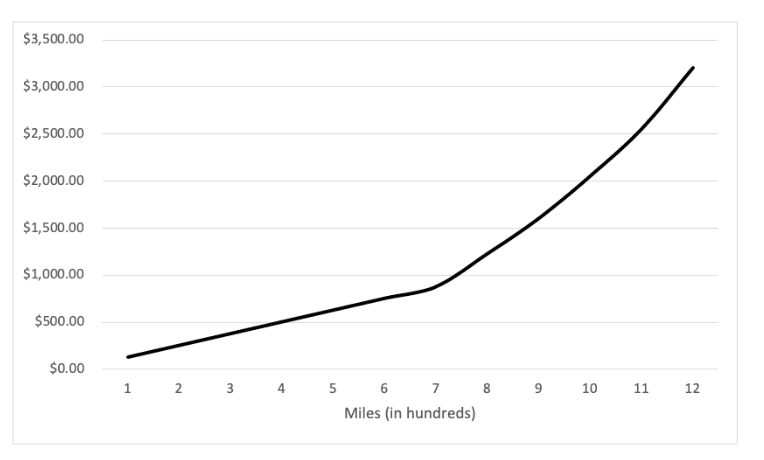
Correct Answer:
Verified
Q255: A researcher is using this data that
Q256: A graph was made comparing the age
Q257: A businesswoman needs to fly to Bulgaria
Q258: A high school asked students which mode
Q259: The graph below shows the relationship between
Q261: For the following numbers, which statement is
Q262: For the following numbers, which is the
Q263: For the following numbers, which is the
Q264: The difference between two numbers divided by
Q265: For the following numbers, which statement is
Unlock this Answer For Free Now!
View this answer and more for free by performing one of the following actions

Scan the QR code to install the App and get 2 free unlocks

Unlock quizzes for free by uploading documents