After the presentation, you are asked to explain the chart. Assume you have applied a full risk-based testing strategy. 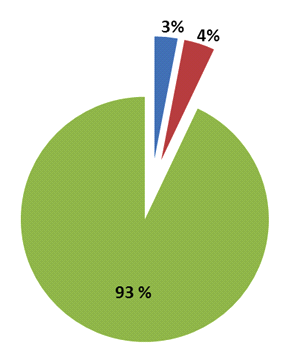 Which of the following answers would you expect to best describe the pie chart? Number of correct responses: 1
A) All the risk items have been covered with tests. No more risk items remain to test
B) According to the full risk-based testing strategy applied, it is very likely that the highest-risk items, tests and bugs remain in the blue and red areas. Therefore, it is very risky to release the application
C) Only the lowest-risk items, tests and bugs should remain in the blue and red areas. Therefore the application can be released at any time subject to management of the items identified in those areas
D) 97 percent of the risk items has been tested. No open bugs or test failures remain. Only 3 percent of risk items remains to be covered by the remaining test
Correct Answer:
Verified
Q1: Which of the following statements, about the
Q2: Which of the following statements describing the
Q3: The main objectives the senior management team
Q4: Consider an agile team adopting Extreme Programming
Q5: For which of the following activities would
Q7: The following are the requirements identified as
Q8: The following are the exit criteria described
Q9: You are following a risk-based testing strategy.
Q10: You are the Test Manager of a
Q11: Assume that no additional product risks have
Unlock this Answer For Free Now!
View this answer and more for free by performing one of the following actions

Scan the QR code to install the App and get 2 free unlocks

Unlock quizzes for free by uploading documents