An analyst generates the following color-coded table shown in the exhibit to help explain the risk of potential incidents in the company. The vertical axis indicates the likelihood of an incident, while the horizontal axis indicates the impact. 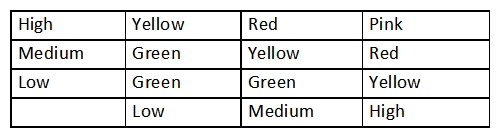 Which of the following is this table an example of?
A) Internal threat assessment
B) Privacy impact assessment
C) Qualitative risk assessment
D) Supply chain assessment
Correct Answer:
Verified
Q839: A customer calls a technician and needs
Q840: A staff member contacts the help desk
Q841: A company wants to ensure users are
Q842: A developer has incorporated routines into the
Q843: Joe, an employee, asks a coworker how
Q845: After reports of slow internet connectivity, a
Q846: A technician has discovered a crypto-virus infection
Q847: A company has just completed a vulnerability
Q848: A security engineer implements multiple technical measures
Q849: A network technician is designing a network
Unlock this Answer For Free Now!
View this answer and more for free by performing one of the following actions

Scan the QR code to install the App and get 2 free unlocks

Unlock quizzes for free by uploading documents