Multiple Choice
Refer to the figure shown.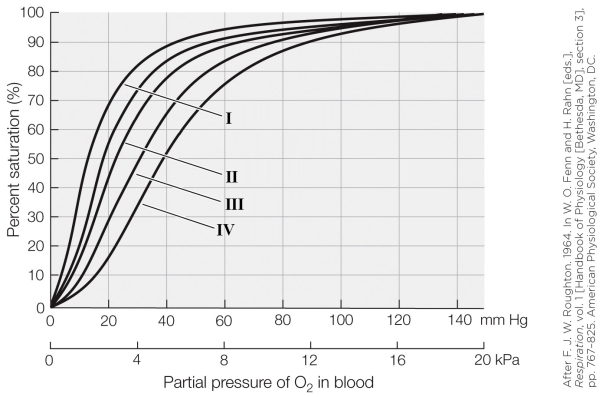 On the graph, which oxygen dissociation curve represents a very high blood pH (e.g., 7.6) ?
A) I
B) II
C) III
D) IV
Correct Answer:
Verified
Related Questions
Q13: In a healthy human at rest, what
Q14: Refer to the figure shown.![]()

