Multiple Choice
Refer to the figure shown.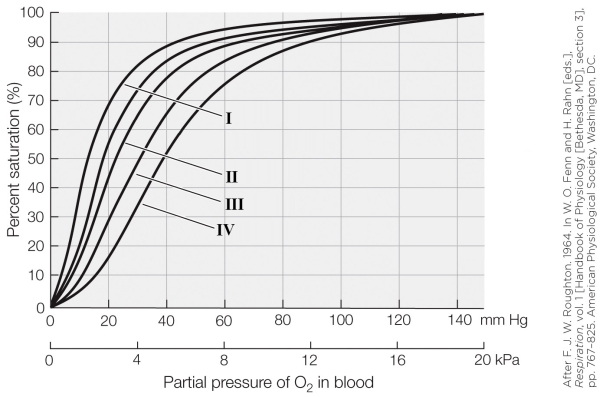 On the graph, which oxygen dissociation curve represents a P50 of about 4 kPa?
A) I
B) II
C) III
D) IV
Correct Answer:
Verified
Related Questions
Refer to the figure shown. On the graph, which oxygen dissociation curve represents a P50 of about 4 kPa?
A) I
B) II
C) III
D) IV
Correct Answer:
Verified

